
Securitised Credit
Rates volatility, tight credit spreads and economic uncertainty is providing multi-asset allocators with a fixed income conundrum. A traditional 60/40 allocation is not the diversifier it once was. We believe the distributed Securitised Credit market could provide the much-needed solution. As this article will show:
- It has a low correlation to traditional asset classes
- The current interest rate regime is favourable for the asset class
- Spreads in the asset class are wider of their historical tights
- Through both the “lower for longer” environment and the current period, Securitised Credit has outperformed corporates on an absolute and risk-adjusted return basis
In our view, not only could Securitised Credit feature in the multi-sector fixed income component of portfolios, it could in fact be the stand-alone asset allocation for institutional multi-asset allocators.
Securitised Credit features in multi-sector fixed income
What may come as a surprise to investors is that Securitised Credit actually already features in multi-sector fixed income allocations either directly through a multi-sector fixed income allocation or indirectly through the Bloomberg Global Aggregate.
Taking a look at the Bloomberg Global Aggregate, Securitised Credit makes up 13 per cent of the index. Of this, the majority (11 per cent) is in US Fixed Rate Agency MBS, with the remainder in Other ABS.
The value of investments and any income from them can go down as well as up and investors may not get back the amount originally invested. Any views expressed were held at the time of preparation and are subject to change without notice. For informational purposes only and should not be construed as a recommendation to invest in the specific country, product, strategy, sector, or security.
Source: Bloomberg, HSBC Asset Management. Data as at 31 July 2025
Is this the right area of Securitised Credit to allocate to?
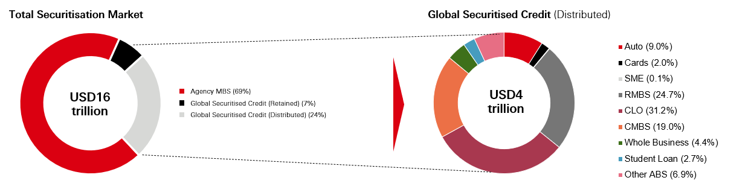
Although US Agency MBS is the largest part of the Securitised Credit universe making up c. USD 11tn, the sole risk here is interest rate risk (the underlying securitisations are explicitly/implicitly guaranteed by government agencies).
Given the current economic backdrop, investors are arguably not being compensated with yield for the duration risk being taken.
An area of Securitised Credit that offers yield enhancement, global opportunities, a unique cash flow profile and diversification benefits is the distributed Securitised Credit universe.
Sources: HSBC Asset Management; Australian Statistics Bureau; Reserve Bank of Australia, JPMorgan, BAML, Barclays; Data as of 31 July 2025.
As the chart on the right-hand side shows above, the distributed universe is large at USD 4tn. It provides investors with access to CLOs, CMBS, RMBS and Other ABS.
Being predominantly floating rate, these sectors are and will continue to generate high levels of income whilst simultaneously stripping out the volatility from duration. Furthermore, the sector benefits from a complexity and illiquidity premium meaning it offers a higher spread than equivalently rated traditional fixed income corporates. Credit spreads in corporate bonds are also at historic tights and are more likely to widen than tighten from these levels.
What’s more is that current spreads in Securitised Credit, as can be seen in the chart below, are wide of the tights achieved during normal market trading levels over the past 10 years. The same cannot be said for traditional fixed income which continues to test new tights.
The real question for Multi-Asset allocators is where is the most relative value? As of 31 July 2025, the ICE BOFA AAA-A US CMBS index has an asset swap spread of 132bps. US AAA CLOs has an asset swap spread of 130bps.
As can be seen on the next page, this is 45bps and 43bps higher respectively than the ICE BOFA AAA-A US Corporate Index.
The value of investments and any income from them can go down as well as up and investors may not get back the amount originally invested. Any views expressed were held at the time of preparation and are subject to change without notice. For informational purposes only and should not be construed as a recommendation to invest in the specific country, product, strategy, sector, or security. Diversification does not ensure a profit or protect against loss.
Source: HSBC Asset Management. Data as at 31 July 2025
Spreads in distributed Securitised Credit offer the most relative historical value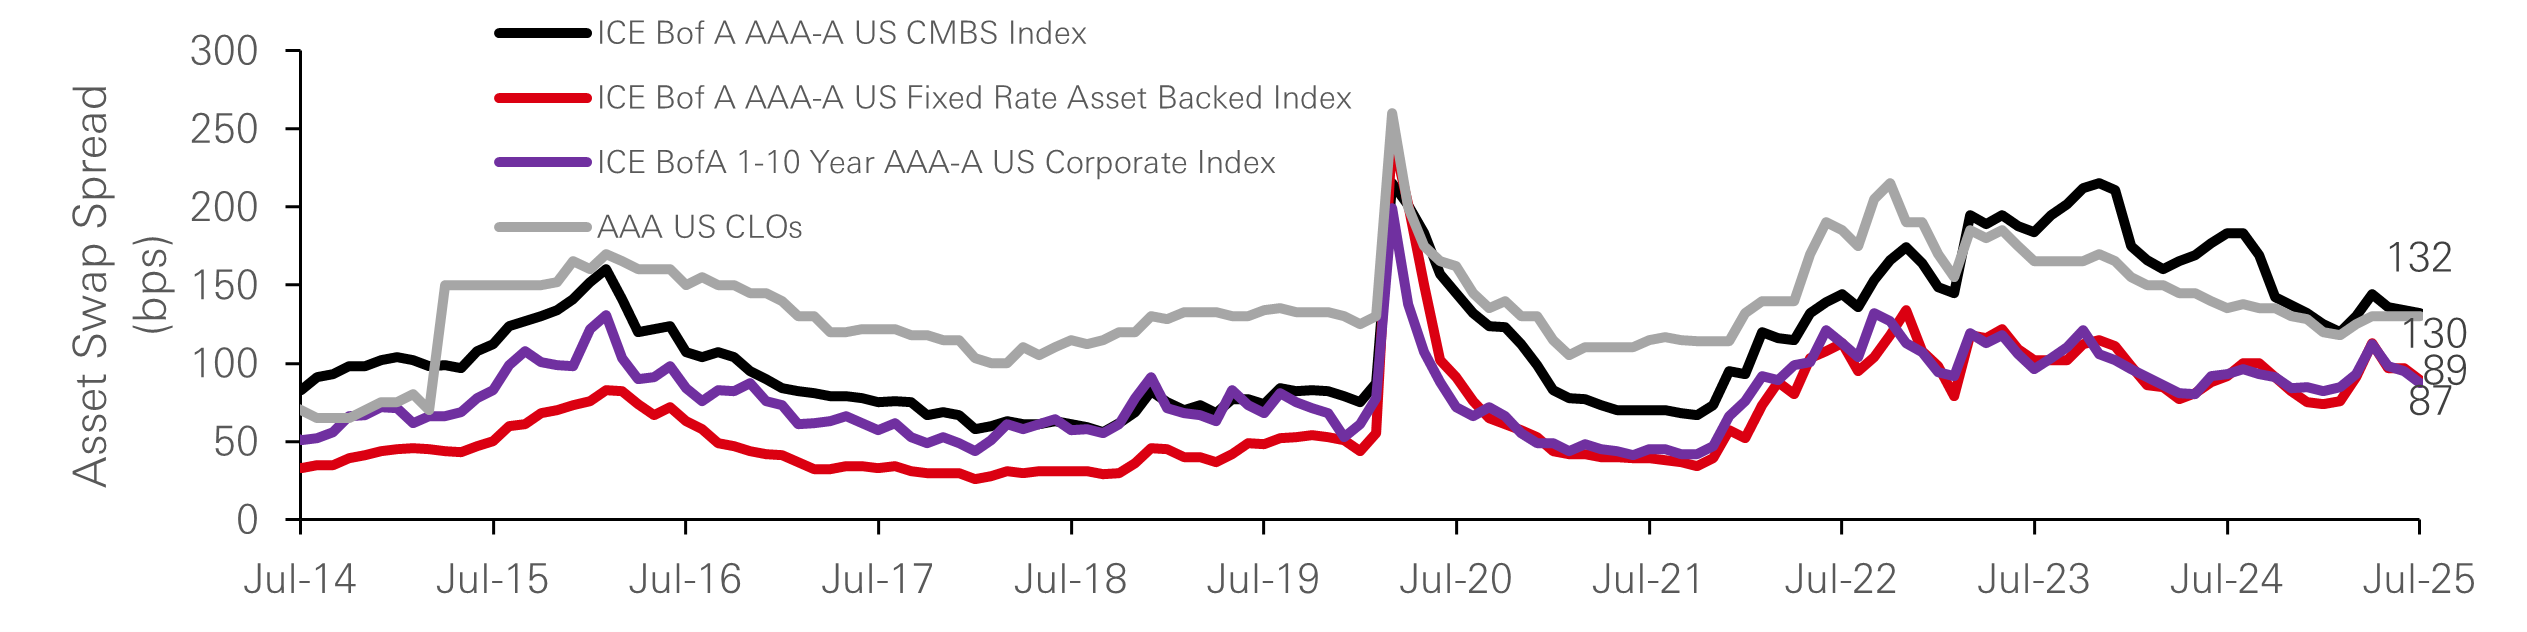
Source: Bloomberg, HSBC Asset Management. Data as at 31 July 2025
What is the optimal allocation to distributed Securitised Credit?
Multi-asset allocators seeking to dip their toes into Securitised Credit might be wondering what is the optimal allocation; we are all well versed in the efficient frontier when it comes to portfolio management. Some multi-sector fixed income managers allocate anywhere between 15 per cent to 60 per cent of their allocation to various types of both fixed and floating rate Securitised Credit.
The below chart would suggest that adding a high quality global Securitised Credit offering to a traditional 60/40 portfolio (combining equities and fixed income) could enhance returns whilst simultaneously lowering overall portfolio volatility. Looking at the past 12 years, a 60/40 portfolio returned 6.0 per cent annually with an annualised portfolio volatility of 10.0 per cent. (Number 1 in the chart below).
Replacing half of the fixed income allocation with the HSBC Global Investment Grade Securitised Credit composite increases annualised portfolio returns by 0.3 per cent and lowers portfolio annualised volatility by 0.2 per cent (Number 2 in the chart below). Replacing the whole fixed income allocation increases annualised portfolio returns by a significant 0.6 per cent and lowers annualised portfolio volatility by 0.3 per cent (Number 3 in the chart below).
This is a significant diversification aspect for investors to consider; at an overall portfolio level, the right kind of Securitised Credit can increase returns whilst lowering volatility.
A global high quality Securitised Credit offering deserves a seat at the Multi-Asset table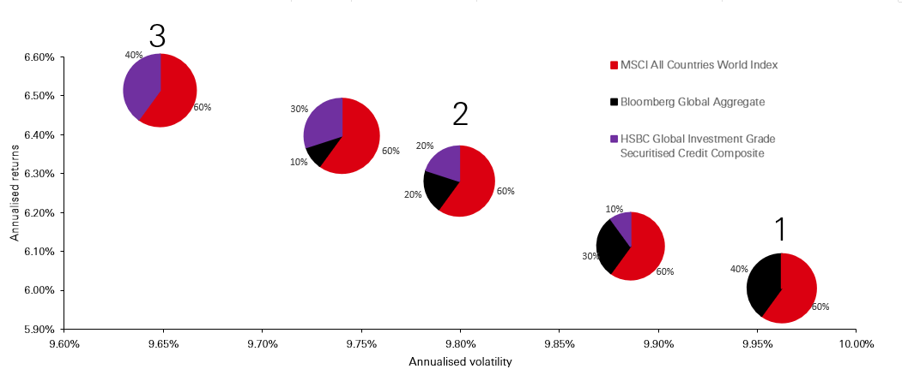
Source: Bloomberg, HSBC Asset Management. Data from 31 July 2013 to 31 July 2025.
The value of investments and any income from them can go down as well as up and investors may not get back the amount originally invested. Past performance does not predict future returns. Any views expressed were held at the time of preparation and are subject to change without notice. For informational purposes only and should not be construed as a recommendation to invest in the specific country, product, strategy, sector, or security. Returns may vary with fluctuations in the exchange rate.
Currently, many multi-asset allocators obtain their Securitised Credit exposure through a multi-sector fixed income approach (similar to the Global Aggregate index). The above highlights they might be missing a trick. It is quite clear to see that including the right kind of Securitised Credit in a multi-asset portfolio provides diversification, higher returns and most importantly higher risk-adjusted returns.
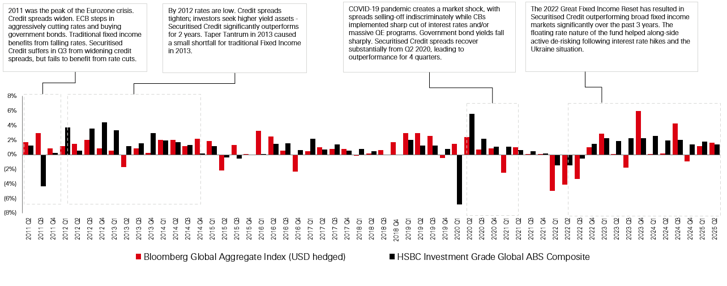
What about an outright allocation? The below chart shows that since 2011 Securitised Credit has outperformed the Bloomberg Global Aggregate.
What’s interesting is that this includes credit shocks such as the Eurozone crisis, the Taper Tantrum, COVID-19 and more recently the Great Fixed Income Reset.
As the chart illustrates, initially the Bloomberg Global Aggregate outperforms due to higher duration exposure especially when compared to Securitised Credit specifically. Being a predominantly floating-rate credit product, the initial impact results in credit spreads widening without the duration protection from interest rates falling.
However, the subsequent recovery in credit spreads results in noticeable outperformance which is driven by the higher income of the asset class. What’s more is that historically these market dislocations have provided opportunities for active managers to source high quality securities at discounted prices.
Securitised Credit can replace Fixed Income in a Multi-Asset portfolio
Source: HSBC Asset Management/Bloomberg Indices. Data as at 30 June 2025, calculated in USD. Returns may vary with fluctuations in the exchange rate.
The value of investments and any income from them can go down as well as up and investors may not get back the amount originally invested. Past performance does not predict future returns. Any views expressed were held at the time of preparation and are subject to change without notice. For informational purposes only and should not be construed as a recommendation to invest in the specific country, product, strategy, sector, or security.
A like-for-like comparison
One might argue that the Global Aggregate index may not be a fair comparator given it has circa 70 per cent in government/government-related bonds vs a “credit-only” Securitised Credit offering.
Comparing an Investment Grade Securitised Credit offering versus a comparatively rated Investment Grade corporates index demonstrates the strong track record of Securitised Credit. As the table below shows, over a 15-year period, the HSBC Global Investment Grade Securitised Credit composite versus the Corporate Index has:
- Outperformed on an absolute basis
- Had a lower volatility profile
- A superior Sharpe ratio
- Due to its unique offering, a low correlation to fixed income corporates
The key takeaway however is that the composite has achieved this with a much lower duration profile. As the table below illustrates, the duration of the HSBC Global Investment Grade Securitised Credit composite of 0.6 years is 10 times lower than that of Bloomberg Global Aggregate corporate index of 6.0 years.
Securitised Credit can replace Fixed Income in a Multi-Asset portfolio

Rolling year returns (per cent)

The value of investments and any income from them can go down as well as up and investors may not get back the amount originally invested. Past performance does not predict future returns. Any views expressed were held at the time of preparation and are subject to change without notice. For informational purposes only and should not be construed as a recommendation to invest in the specific country, product, strategy, sector, or security.
Source: HSBC Asset Management and Bloomberg. Data as at 31 July 2025, calculated in USD. All strategies and indices are USD hedged. Past performance is shown gross of fees, meaning any potential returns will be reduced by the deduction of investment management fees and any other expenses incurred. The Composite are denominated in USD. Returns may vary with fluctuations in the exchange rate. This material is supplemental to GIPS compliance requirements and is provided for your information. This supplemental material complements the GIPS compliant composite presentation which is available in the appendix. Please refer to the GIPS disclosure statement in the appendix for the impact of investment advisory fees and expenses on performance and for benchmark definitions. Performance data for the HSBC Global Investment Grade Securitised Credit Composite and the Bloomberg Global Aggregate Index is for the period 30 Jun 2010 to 31 July 2025.
Notes: (1) Correlations pre-Covid-19 were 0.30 (end-Jan 2020). (2) Duration refers to modified duration.
The demand is there
The asset class has many features that meet a diverse range of investors’ requirements:
- As can be seen above, Multi-Asset allocators can benefit from the low correlation and diversification benefits.
- For pension funds, defined contribution and defined benefit strategies, Securitised Credit provides compelling income via yield enhancement.
- For insurance companies (subject to the underlying applied regulatory environment), it offers compelling capital treatment with higher returns than traditional fixed income with similar credit charges.
- Private Banks and Family Offices like the diversification, income generation and low correlations.
- Corporate Treasurers, looking for high-quality, higher-yielding alternatives to lower cash rates, have been allocating to Securitised Credit within their longer-term strategic cash bucket.
Conclusion
Multi-Sector fixed income is at a difficult juncture; rates markets are volatile, and traditional credit is struggling to offer risk-adjusted value going forwards. The USD 4tn distributed Securitised Credit market is predominately floating rate, always offers a higher spread over corporates and is currently wider of its historical market tights. Securitised markets move differently to traditional asset classes meaning combined with a higher return profile, it also offers clear investor diversification benefits. Indeed, as illustrated above, it can enhance the return of a traditional 60/40 portfolio whilst lowering overall volatility. In fact, looking over the longer-term, Multi-Asset allocators could replace their current traditional fixed income allocation directly with Securitised Credit and fully reap the benefits and rewards that the asset class has to offer.
The value of investments and any income from them can go down as well as up and investors may not get back the amount originally invested. Any views expressed were held at the time of preparation and are subject to change without notice. For informational purposes only and should not be construed as a recommendation to invest in the specific country, product, strategy, sector, or security.
Source: HSBC Asset Management. Data as at 31 July 2025


