Market spotlight: From tariff cloud to trade tailwind
India’s macro narrative shifted rapidly in early February, moving from a trade-related overhang to a clearer policy-anchored outlook. The India–US trade deal has removed a substantial cloud that hung over markets, with Washington rolling back the 25 per cent penalty on Russian oil linked imports and cut the ‘reciprocal’ tariff so that the effective rate on Indian goods dropped to 18 per cent from about 50 per cent. In return, India is expected to gradually lower tariffs on US goods and deepen bilateral trade engagement, while targeting USD500 billion of imports over five years and strengthening both economic and diplomatic ties.
The market reaction to the deal underscores how significant that cloud had become. The absence of a meaningful trade deal with the US had weighed on sentiment contributing to the largest ever annual net foreign outflow in Indian equities of USD18 billion, muted foreign participation in debt markets, and a weaker INR against USD in three years with a 4.7 per cent annual drop. Right after the deal announcement, the Nifty 50 rose as much as 5 per cent and the rupee gained around 1.4 per cent against the dollar, its strongest daily move in more than seven years, with USD/INR falling to 90.27 and investors now openly debating a break into the high 80s as foreign flows return. This contrasted with the relatively muted response to the India–EU agreement, highlighting the importance of US trade relations for near-term market confidence.
Net foreign flows in India capital market versus INR-USD spot change year-on-year
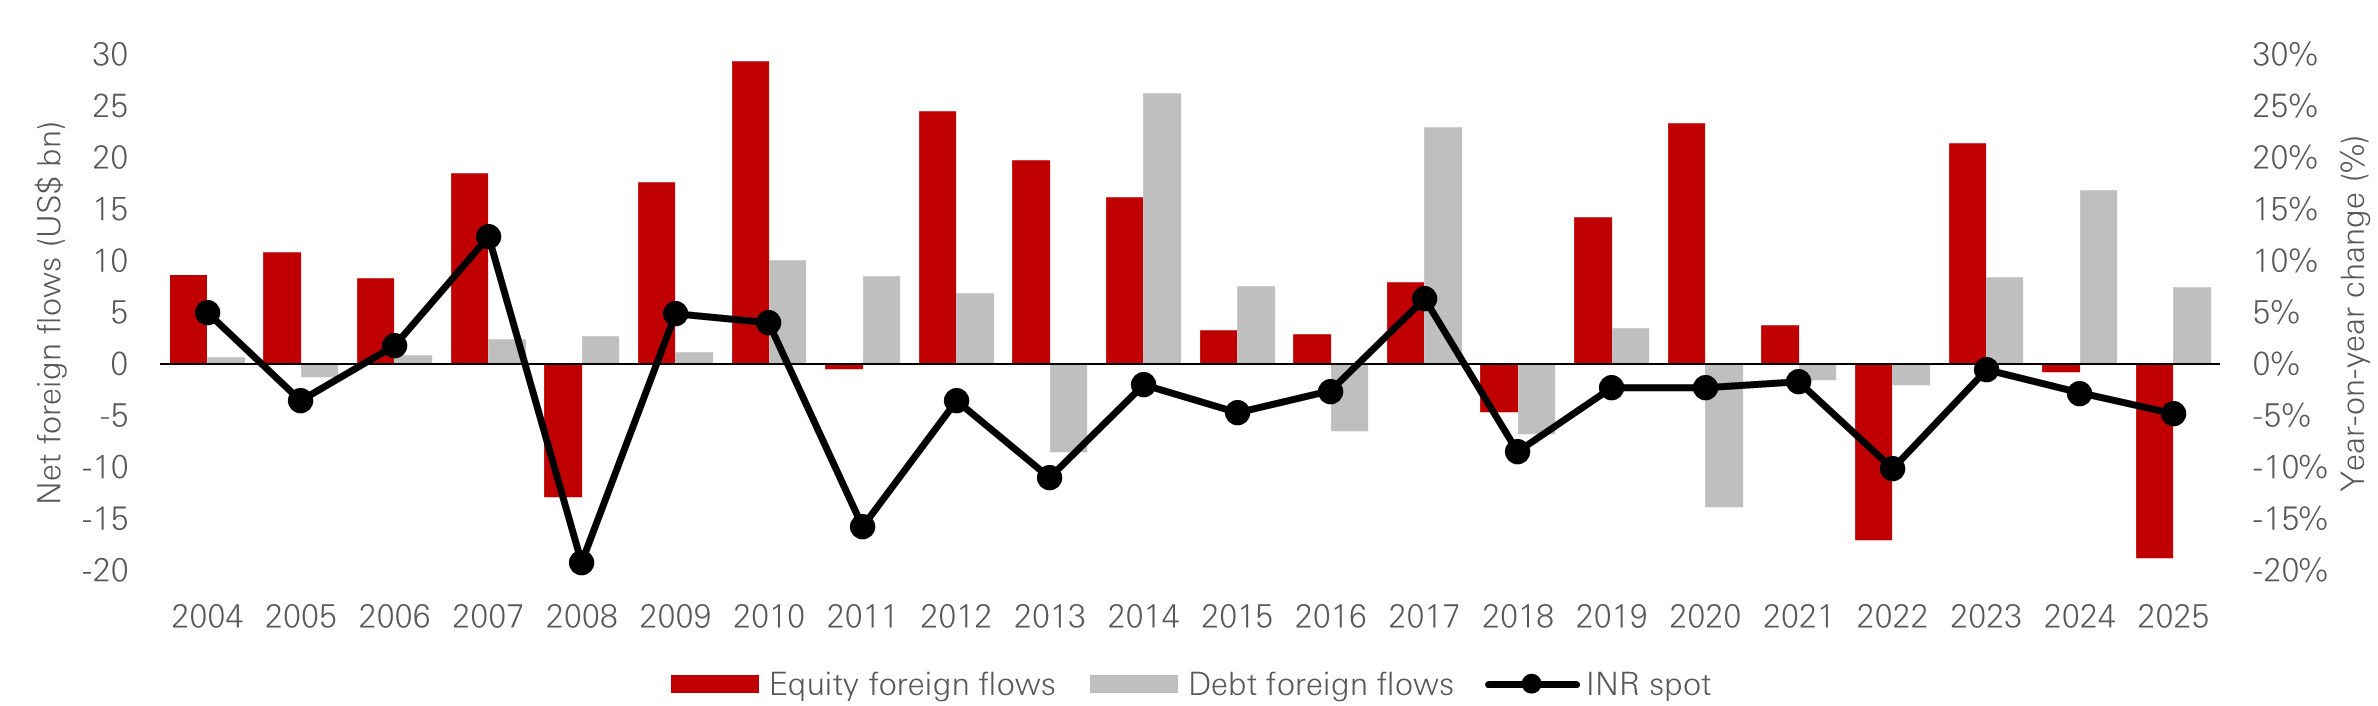
Source: Bloomberg, HSBC Asset Management, January 2026.
At the same time, the recently announced Union Budget reaffirmed a gradual consolidation path, while keeping its foot firmly on the public investment accelerator. The government capex outlay was raised to INR 12.2 trillion, focusing on infrastructure, logistics, electronics, semiconductors, containers and energy security, including nuclear, rare earths and carbon capture, reinforcing a public investment led growth strategy. This injection of public cash has boosted real GDP projections to 6.8–7.2 per cent and nominal growth at 10 per cent. These estimates are further underpinned by tax buoyancy, stable GST and INR 3.16 trillion of dividends from the RBI and state-owned financial institutions. Overall, with the tariff shock fading and fiscal policy still growth friendly, India enters 2026 with sentiment healing and a clearer macro anchor.
India equities
Domestic buffers meet a new external catalyst
After a period when foreign selling and tariff uncertainty dominated price action, the removal of the US tariff penalty has allowed the Indian equity market to re focus on fundamentals. Currently, three drivers anchor the equity outlook: strong domestic liquidity, stabilising earnings, and a new external catalyst from the US trade agreement.
Domestic liquidity in the form of institutional flows and steady retail participation has produced record domestic inflows of USD86 billion, helping absorb foreign selling, cushion downside volatility and prevent disorderly drawdowns. This transition signals that India is becoming less dependent on foreign risk appetite to sustain equity performance than in previous cycles.
 |
Trade agreements will help improve sentiment, but earnings dispersion will drive returns. |
Ownership trend across promoters and non-promoters in the NSE-listed universe
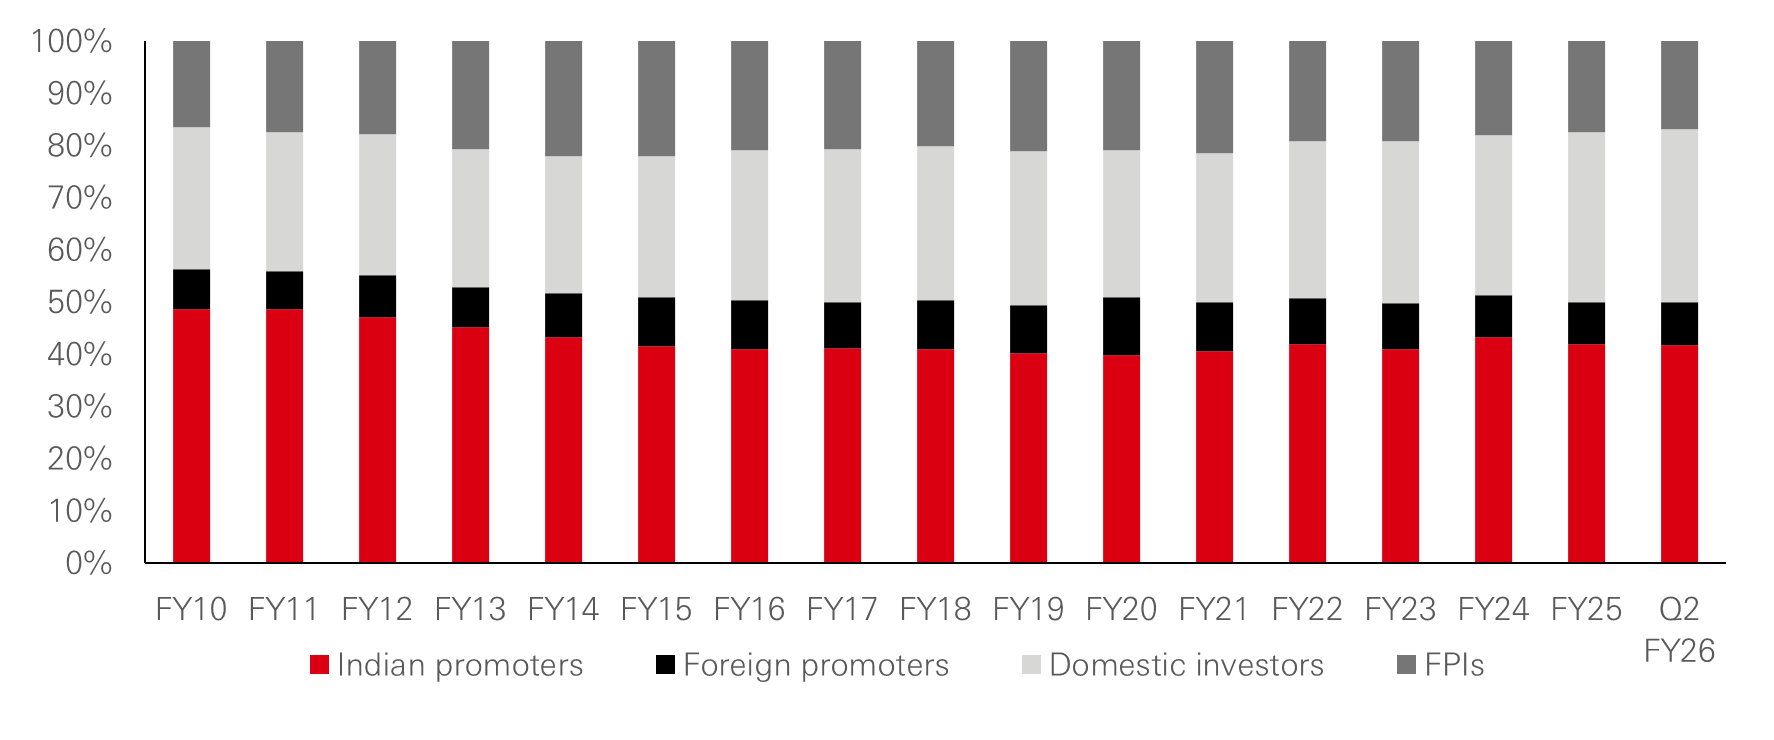
Source: CMIE Prowess, NSE EPR, NSE India Ownership Tracker. Data as of January 2026.
Note: Financial year in India runs from April to March. Thus, FY26 denotes the period April 2025 – March 2026.
The underlying earnings picture is also more balanced than headlines suggest. Earlier downgrades have given way to stabilisation as financing costs ease and operating leverage returns in rate sensitive sectors such as financials, real estate and consumer discretionary. The Union Budget’s emphasis on consistency, capex and consolidation reinforces this, with continuity in tax policy, a deliberate sectoral push for MSMEs, textiles and ‘Semiconductors 2.0’, and a 20-year tax holiday for data centres in high tech segments. Public capex on infrastructure and logistics should support order books for industrials and construction, while semiconductor and AI related incentives open a higher value manufacturing and digital infrastructure theme.
The trade deal adds an earnings lever that was largely absent over the past year. The US is already India’s largest export destination, with USD87 billion of exports in FY25, concentrated in textiles, gems and jewellery, marine products and other tariff sensitive categories. Lower effective tariffs should gradually support volumes and margins in these segments, particularly as India’s tariff profile converges towards that of regional peers, without sacrificing its existing surplus with the US.
For investors, the equity story shifts from binary trade risk toward earnings normalisation supported by external relief and domestic demand, with export sectors benefiting incrementally while domestic financials and capex-linked industries continue to anchor the index. The shift towards semiconductors and AI adjacent spending should, over time, support both earnings growth and credit quality, �creating a more durable backdrop for equity risk taking.
India fixed income
Short-term carry amid slow consolidation
For fixed income, the same trade-and-budget mix translates into a more nuanced configuration. While fiscal intent remains disciplined, government bond supply is heavy just as the external constraint eases. The Union Budget keeps the deficit on a slow glide path, from 4.4 per cent of GDP in FY26 to 4.3 per cent in FY27, and adheres to a debt-to-GDP reduction trajectory towards roughly 50 per cent by FY31, with FY27 projected at 55.6 per cent. The adjustment relies more on nominal growth than on deep expenditure cuts, with total spending set to grow 7.7 per cent y-o-y.
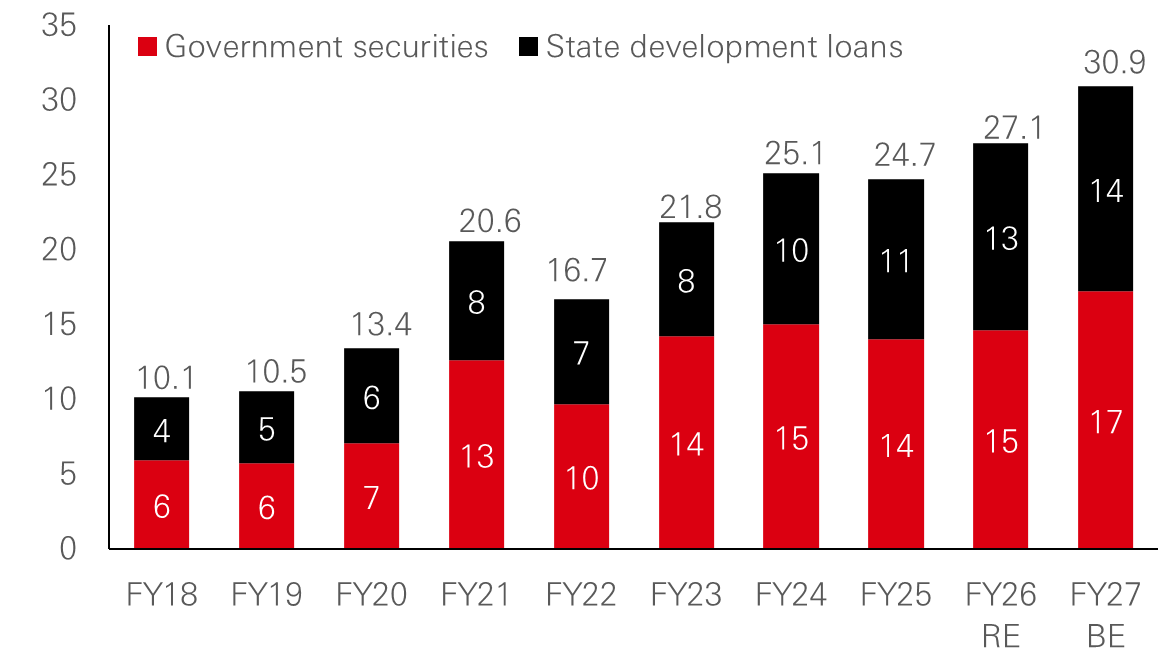
The challenge lies squarely in borrowing. Net market borrowing for FY27 is pegged at INR 11.7 trillion, only slightly above expectations. Gross market borrowing was initially set at INR 17.2 trillion, but after the Government of India switched INR 0.75 trillion of FY27 maturities into longer bonds, gross borrowing is now closer to the market expectations of INR 16.5 trillion. This swift execution has helped calm nerves and contributed to a partial recovery in bond prices after the post-budget sell-off. The government expects small-savings funding to grow by just 4 per cent; if actual growth is higher, borrowing needs may decrease further. At the same time, bond market development measures, including incentives for municipal bonds, corporate bond index derivatives, and total return swaps, are positive steps toward greater market depth and improved hedging opportunities.
 |
Policy anchors the front-end, but long yields will be shaped by supply and foreign flows. |
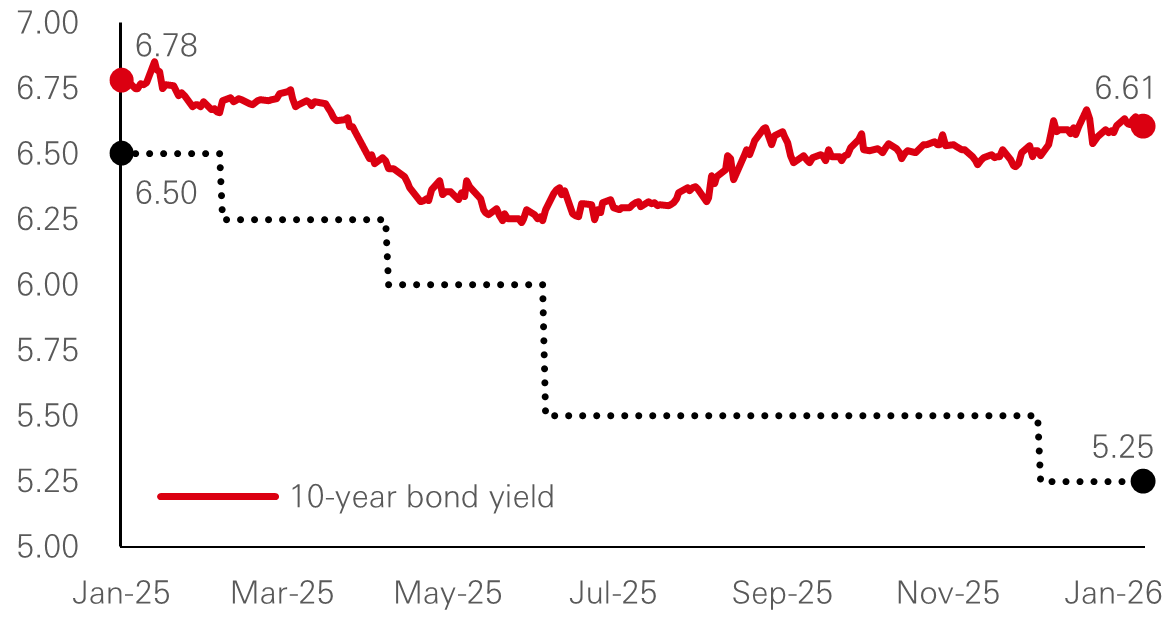
India RBI repo rate and 10-year bond yield in 2025
Gross supply of India government bonds (INR trillion)
Past performance does not predict future returns. The level of yield is not guaranteed and may rise or fall in the future.
Source: HSBC Asset Management, Bloomberg, RBI, CMIE database, India Budget documents, February 2026.
Note: FY27 G-sec is as per Budget Estimates announced on 1-Feb. SDLs for both FY26, FY27 are estimated figures. BE: Budget estimate; RE: Revised estimate.
With rate-cut expectations largely priced in and inflation near the lower end of recent ranges, the RBI is likely to focus on market stabilisation via open-market operations (OMOs) and liquidity tools, having already absorbed a significant share of net supply up to February FY26. Over the coming weeks, markets will look for an announcement of around INR 1 trillion of OMOs and for a continuation of a more favourable borrowing mix, with expectations of relatively less supply at the very long end.
Against this backdrop, the US trade deal acts as a meaningful offset for both rates and FX. The trade deal improves balance-of-payments expectations and reduces currency risk premia, potentially encouraging renewed foreign interest in local bonds.�In this environment, the case is for emphasising higher absolute carry over structural duration, adding tenor opportunistically on yield back ups while favouring local �credit spreads, where the semiconductor and AI driven capex pivot and still �supportive growth backdrop should underpin corporate fundamentals.
For Professional Clients and intermediaries within countries and territories set out below; and for Institutional Investors and Financial Advisors in the US. This document should not be distributed to or relied upon by Retail clients/investors.
The value of investments and the income from them can go down as well as up and investors may not get back the amount originally invested. The performance figures contained in this document relate to past performance, which should not be seen as an indication of future returns. Future returns will depend, inter alia, on market conditions, investment manager’s skill, risk level and fees. Where overseas investments are held the rate of currency exchange may cause the value of such investments to go down as well as up. Investments in emerging markets are by their nature higher risk and potentially more volatile than those inherent in some established markets. Economies in emerging markets generally are heavily dependent upon international trade and, accordingly, have been and may continue to be affected adversely by trade barriers, exchange controls, managed adjustments in relative currency values and other protectionist measures imposed or negotiated by the countries and territories with which they trade. These economies also have been and may continue to be affected adversely by economic conditions in the countries and territories in which they trade.
The contents of this document may not be reproduced or further distributed to any person or entity, whether in whole or in part, for any purpose. All non-authorised reproduction or use of this document will be the responsibility of the user and may lead to legal proceedings. The material contained in this document is for general information purposes only and does not constitute advice or a recommendation to buy or sell investments. Some of the statements contained in this document may be considered forward looking statements which provide current expectations or forecasts of future events. Such forward looking statements are not guarantees of future performance or events and involve risks and uncertainties. Actual results may differ materially from those described in such forward-looking statements as a result of various factors. We do not undertake any obligation to update the forward-looking statements contained herein, or to update the reasons why actual results could differ from those projected in the forward-looking statements. This document has no contractual value and is not by any means intended as a solicitation, nor a recommendation for the purchase or sale of any financial instrument in any jurisdiction in which such an offer is not lawful. The views and opinions expressed herein are those of HSBC Asset Management at the time of preparation and are subject to change at any time. These views may not necessarily indicate current portfolios' composition. Individual portfolios managed by HSBC Asset Management primarily reflect individual clients' objectives, risk preferences, time horizon, and market liquidity. Foreign and emerging markets: investments in foreign markets involve risks such as currency rate fluctuations, potential differences in accounting and taxation policies, as well as possible political, economic, and market risks. These risks are heightened for investments in emerging markets which are also subject to greater illiquidity and volatility than developed foreign markets. This commentary is for information purposes only. It is a marketing communication and does not constitute investment advice or a recommendation to any reader of this content to buy or sell investments nor should it be regarded as investment research. It has not been prepared in accordance with legal requirements designed to promote the independence of investment research and is not subject to any prohibition on dealing ahead of its dissemination. This document is not contractually binding nor are we required to provide this to you by any legislative provision.
All data from HSBC Asset Management unless otherwise specified. Any third-party information has been obtained from sources we believe to be reliable, but which we have not independently verified.
HSBC Asset Management is the brand name for the asset management business of HSBC Group, which includes the investment activities that may be provided through our local regulated entities. HSBC Asset Management is a group of companies in many countries and territories throughout the world that are engaged in investment advisory and fund management activities, which are ultimately owned by HSBC Holdings Plc. (HSBC Group).
- In Australia, this document is issued by HSBC Bank Australia Limited ABN 48 006 434 162, AFSL 232595, for HSBC Global Asset Management (Hong Kong) Limited ARBN 132 834 149 and HSBC Global Asset Management (UK) Limited ARBN 633 929 718. This document is for institutional investors only and is not available for distribution to retail clients (as defined under the Corporations Act). HSBC Global Asset Management (Hong Kong) Limited and HSBC Global Asset Management (UK) Limited are exempt from the requirement to hold an Australian financial services license under the Corporations Act in respect of the financial services they provide. HSBC Global Asset Management (Hong Kong) Limited is regulated by the Securities and Futures Commission of Hong Kong under the Hong Kong laws, which differ from Australian laws. HSBC Global Asset Management (UK) Limited is regulated by the Financial Conduct Authority of the United Kingdom and, for the avoidance of doubt, includes the Financial Services Authority of the United Kingdom as it was previously known before 1 April 2013, under the laws of the United Kingdom, which differ from Australian laws;
- In Bermuda, this document is issued by HSBC Global Asset Management (Bermuda) Limited, of 37 Front Street, Hamilton, Bermuda which is licensed to conduct investment business by the Bermuda Monetary Authority;
- In Germany, this document is issued by HSBC Global Asset Management (Deutschland) GmbH which is regulated by BaFin (German clients) respective by the Austrian Financial Market Supervision FMA (Austrian clients);
- In Hong Kong, this document is issued by HSBC Global Asset Management (Hong Kong) Limited, which is regulated by the Securities and Futures Commission. This content has not been reviewed by the Securities and Futures Commission;
- In India, this document is issued by HSBC Asset Management (India) Pvt Ltd. which is regulated by the Securities and Exchange Board of India;
- In Italy and Spain, this document is issued by HSBC Global Asset Management (France), a Portfolio Management Company authorised by the French regulatory authority AMF (no. GP99026) and through the Italian and Spanish branches of HSBC Global Asset Management (France), regulated respectively by Banca d’Italia and Commissione Nazionale per le Società e la Borsa (Consob) in Italy, and the Comisión Nacional del Mercado de Valores (CNMV) in Spain;
- In Malta, this document is issued by HSBC Global Asset Management (Malta) Limited which is regulated and licensed to conduct Investment Services by the Malta Financial Services Authority under the Investment Services Act;
- In Mexico, this document is issued by HSBC Global Asset Management (Mexico), SA de CV, Sociedad Operadora de Fondos de Inversión, Grupo Financiero HSBC which is regulated by Comisión Nacional Bancaria y de Valores;
- in Malta by HSBC Global Asset Management (Malta) Limited which is regulated and licensed to conduct Investment Services by the Malta Financial Services Authority under the Investment Services Act;
- in Mexico by HSBC Global Asset Management (Mexico), SA de CV, Sociedad Operadora de Fondos de Inversión, Grupo Financiero HSBC which is regulated by Comisión Nacional Bancaria y de Valores;
- In the United Arab Emirates, this document is issued by HSBC Investment Funds (Luxembourg) S.A. – Dubai Branch (Level 20, HSBC Tower, PO Box 66, Downtown Dubai, United Arab Emirates) regulated by the Capital Market Authority (CMA) in the UAE to conduct investment fund management, portfolios management, fund administration activities (CMA Category 2 license No.20200000336) and promotion activities (CMA Category 5 license No.20200000327).
- In the United Arab Emirates, this document is issued by HSBC Global Asset Management MENA, a unit within HSBC Bank Middle East Limited, U.A.E Branch, PO Box 66 Dubai, UAE, regulated by the Central Bank of the U.A.E. and the Capital Market Authority in the UAE under CMA license number 602004 for the purpose of this promotion and lead regulated by the Dubai Financial Services Authority. HSBC Bank Middle East Limited is a member of the HSBC Group and HSBC Global Asset Management MENA are marketing the relevant product only in a sub-distributing capacity on a principal-to-principal basis. HSBC Global Asset Management MENA may not be licensed under the laws of the recipient’s country of residence and therefore may not be subject to supervision of the local regulator in the recipient’s country of residence. One of more of the products and services of the manufacturer may not have been approved by or registered with the local regulator and the assets may be booked outside of the recipient’s country of residence.
- In Singapore, this document is issued by HSBC Global Asset Management (Singapore) Limited, which is regulated by the Monetary Authority of Singapore. The content in the document/video has not been reviewed by the Monetary Authority of Singapore;
- In Switzerland, this document is issued by HSBC Global Asset Management (Switzerland) AG. This document is intended for professional investor use only. For opting in and opting out according to FinSA, please refer to our website; if you wish to change your client categorization, please inform us. HSBC Global Asset Management (Switzerland) AG having its registered office at Gartenstrasse 26, PO Box, CH-8002 Zurich has a licence as an asset manager of collective investment schemes and as a representative of foreign collective investment schemes. Disputes regarding legal claims between the Client and HSBC Global Asset Management (Switzerland) AG can be settled by an ombudsman in mediation proceedings. HSBC Global Asset Management (Switzerland) AG is affiliated to the ombudsman FINOS having its registered address at Talstrasse 20, 8001 Zurich. There are general risks associated with financial instruments, please refer to the Swiss Banking Association (“SBA”) Brochure “Risks Involved in Trading in Financial Instruments”;
- In Taiwan, this document is issued by HSBC Global Asset Management (Taiwan) Limited which is regulated by the Financial Supervisory Commission R.O.C. (Taiwan);
- In Turkiye, this document is issued by HSBC Asset Management A.S. Turkiye (AMTU) which is regulated by Capital Markets Board of Turkiye. Any information here is not intended to distribute in any jurisdiction where AMTU does not have a right to. Any views here should not be perceived as investment advice, product/service offer and/or promise of income. Information given here might not be suitable for all investors and investors should be giving their own independent decisions. The investment information, comments and advice given herein are not part of investment advice activity. Investment advice services are provided by authorized institutions to persons and entities privately by considering their risk and return preferences, whereas the comments and advice included herein are of a general nature. Therefore, they may not fit your financial situation and risk and return preferences. For this reason, making an investment decision only by relying on the information given herein may not give rise to results that fit your expectations.
- In the UK, this document is issued by HSBC Global Asset Management (UK) Limited, which is authorised and regulated by the Financial Conduct Authority;
- In the US, this document is issued by HSBC Securities (USA) Inc., an HSBC broker dealer registered in the US with the Securities and Exchange Commission under the Securities Exchange Act of 1934. HSBC Securities (USA) Inc. is also a member of NYSE/FINRA/SIPC. HSBC Securities (USA) Inc. is not authorized by or registered with any other non-US regulatory authority. The contents of this document are confidential and may not be reproduced or further distributed to any person or entity, whether in whole or in part, for any purpose without prior written permission.
- In Chile, operations by HSBC's headquarters or other offices of this bank located abroad are not subject to Chilean inspections or regulations and are not covered by warranty of the Chilean state. Obtain information about the state guarantee to deposits at your bank or on www.cmfchile.cl;
- In Colombia, HSBC Bank USA NA has an authorized representative by the Superintendencia Financiera de Colombia (SFC) whereby its activities conform to the General Legal Financial System. SFC has not reviewed the information provided to the investor. This document is for the exclusive use of institutional investors in Colombia and is not for public distribution;
- In Costa Rica, the Fund and any other products or services referenced in this document are not registered with the Superintendencia General de Valores (“SUGEVAL”) and no regulator or government authority has reviewed this document, or the merits of the products and services referenced herein. This document is directed at and intended for institutional investors only.
- In Peru, HSBC Bank USA NA has an authorized representative by the Superintendencia de Banca y Seguros in Perú whereby its activities conform to the General Legal Financial System - Law No. 26702. Funds have not been registered before the Superintendencia del Mercado de Valores (SMV) and are being placed by means of a private offer. SMV has not reviewed the information provided to the investor. This document is for the exclusive use of institutional investors in Perú and is not for public distribution;
- In Uruguay, operations by HSBC's headquarters or other offices of this bank located abroad are not subject to Uruguayan inspections or regulations and are not covered by warranty of the Uruguayan state. Further information may be obtained about the state guarantee to deposits at your bank or on www.bcu.gub.uy.
Copyright © HSBC Global Asset Management Limited 2026. All rights reserved. No part of this publication may be reproduced, stored in a retrieval system, or transmitted, on any form or by any means, electronic, mechanical, photocopying, recording, or otherwise, without the prior written permission of HSBC Asset Management.
Content ID: D064737_v3.0; Expiry Date: 31.01.2027
